What is Franchisee Analytics
-
It’s a dashboard that shows how a specific location or department (group / franchisee) is performing in terms of messaging, contacts, and engagement.
-
Everything is scoped to that location / group — so you see metrics within that context, not for the whole system.
-
The default evaluation period is Last 30 Days, but you can change it to other ranges like Last 7, Current Month, Last Month, Last 90 Days (if data exists), or a custom period.
Why It’s Useful / Value Proposition
-
Allows a franchise location to monitor its own performance in messaging and contact behavior (not just global).
-
Helps identify which campaigns, automations, or message types are working locally (or failing).
-
Offers comparisons over time (current vs previous period) so you see growth, declines, or changes.
-
The separation of affiliated vs preferred contacts helps understand shared vs owned contacts and target strategies accordingly.
-
Filtering by resource type and audience helps you drill into where your messaging is coming from (campaigns, automations, playbooks, etc.).
-
Ability to drill into individual resources (campaigns, automations) lets you troubleshoot or optimize a specific piece without guessing.
Dashboard
The Franchisee Analytics Dashboard provides overall performance related to the activities that have been happening within the scope of this Voxie Location or Department (Groups) instance. You can change this default evaluation period of Last 30 Days from the following options:
Last 7 Calendar DaysMonday to TodayCurrent MonthLast MonthLast 30 DaysLast 90 Days(will show up only when 90 days data has been collected)
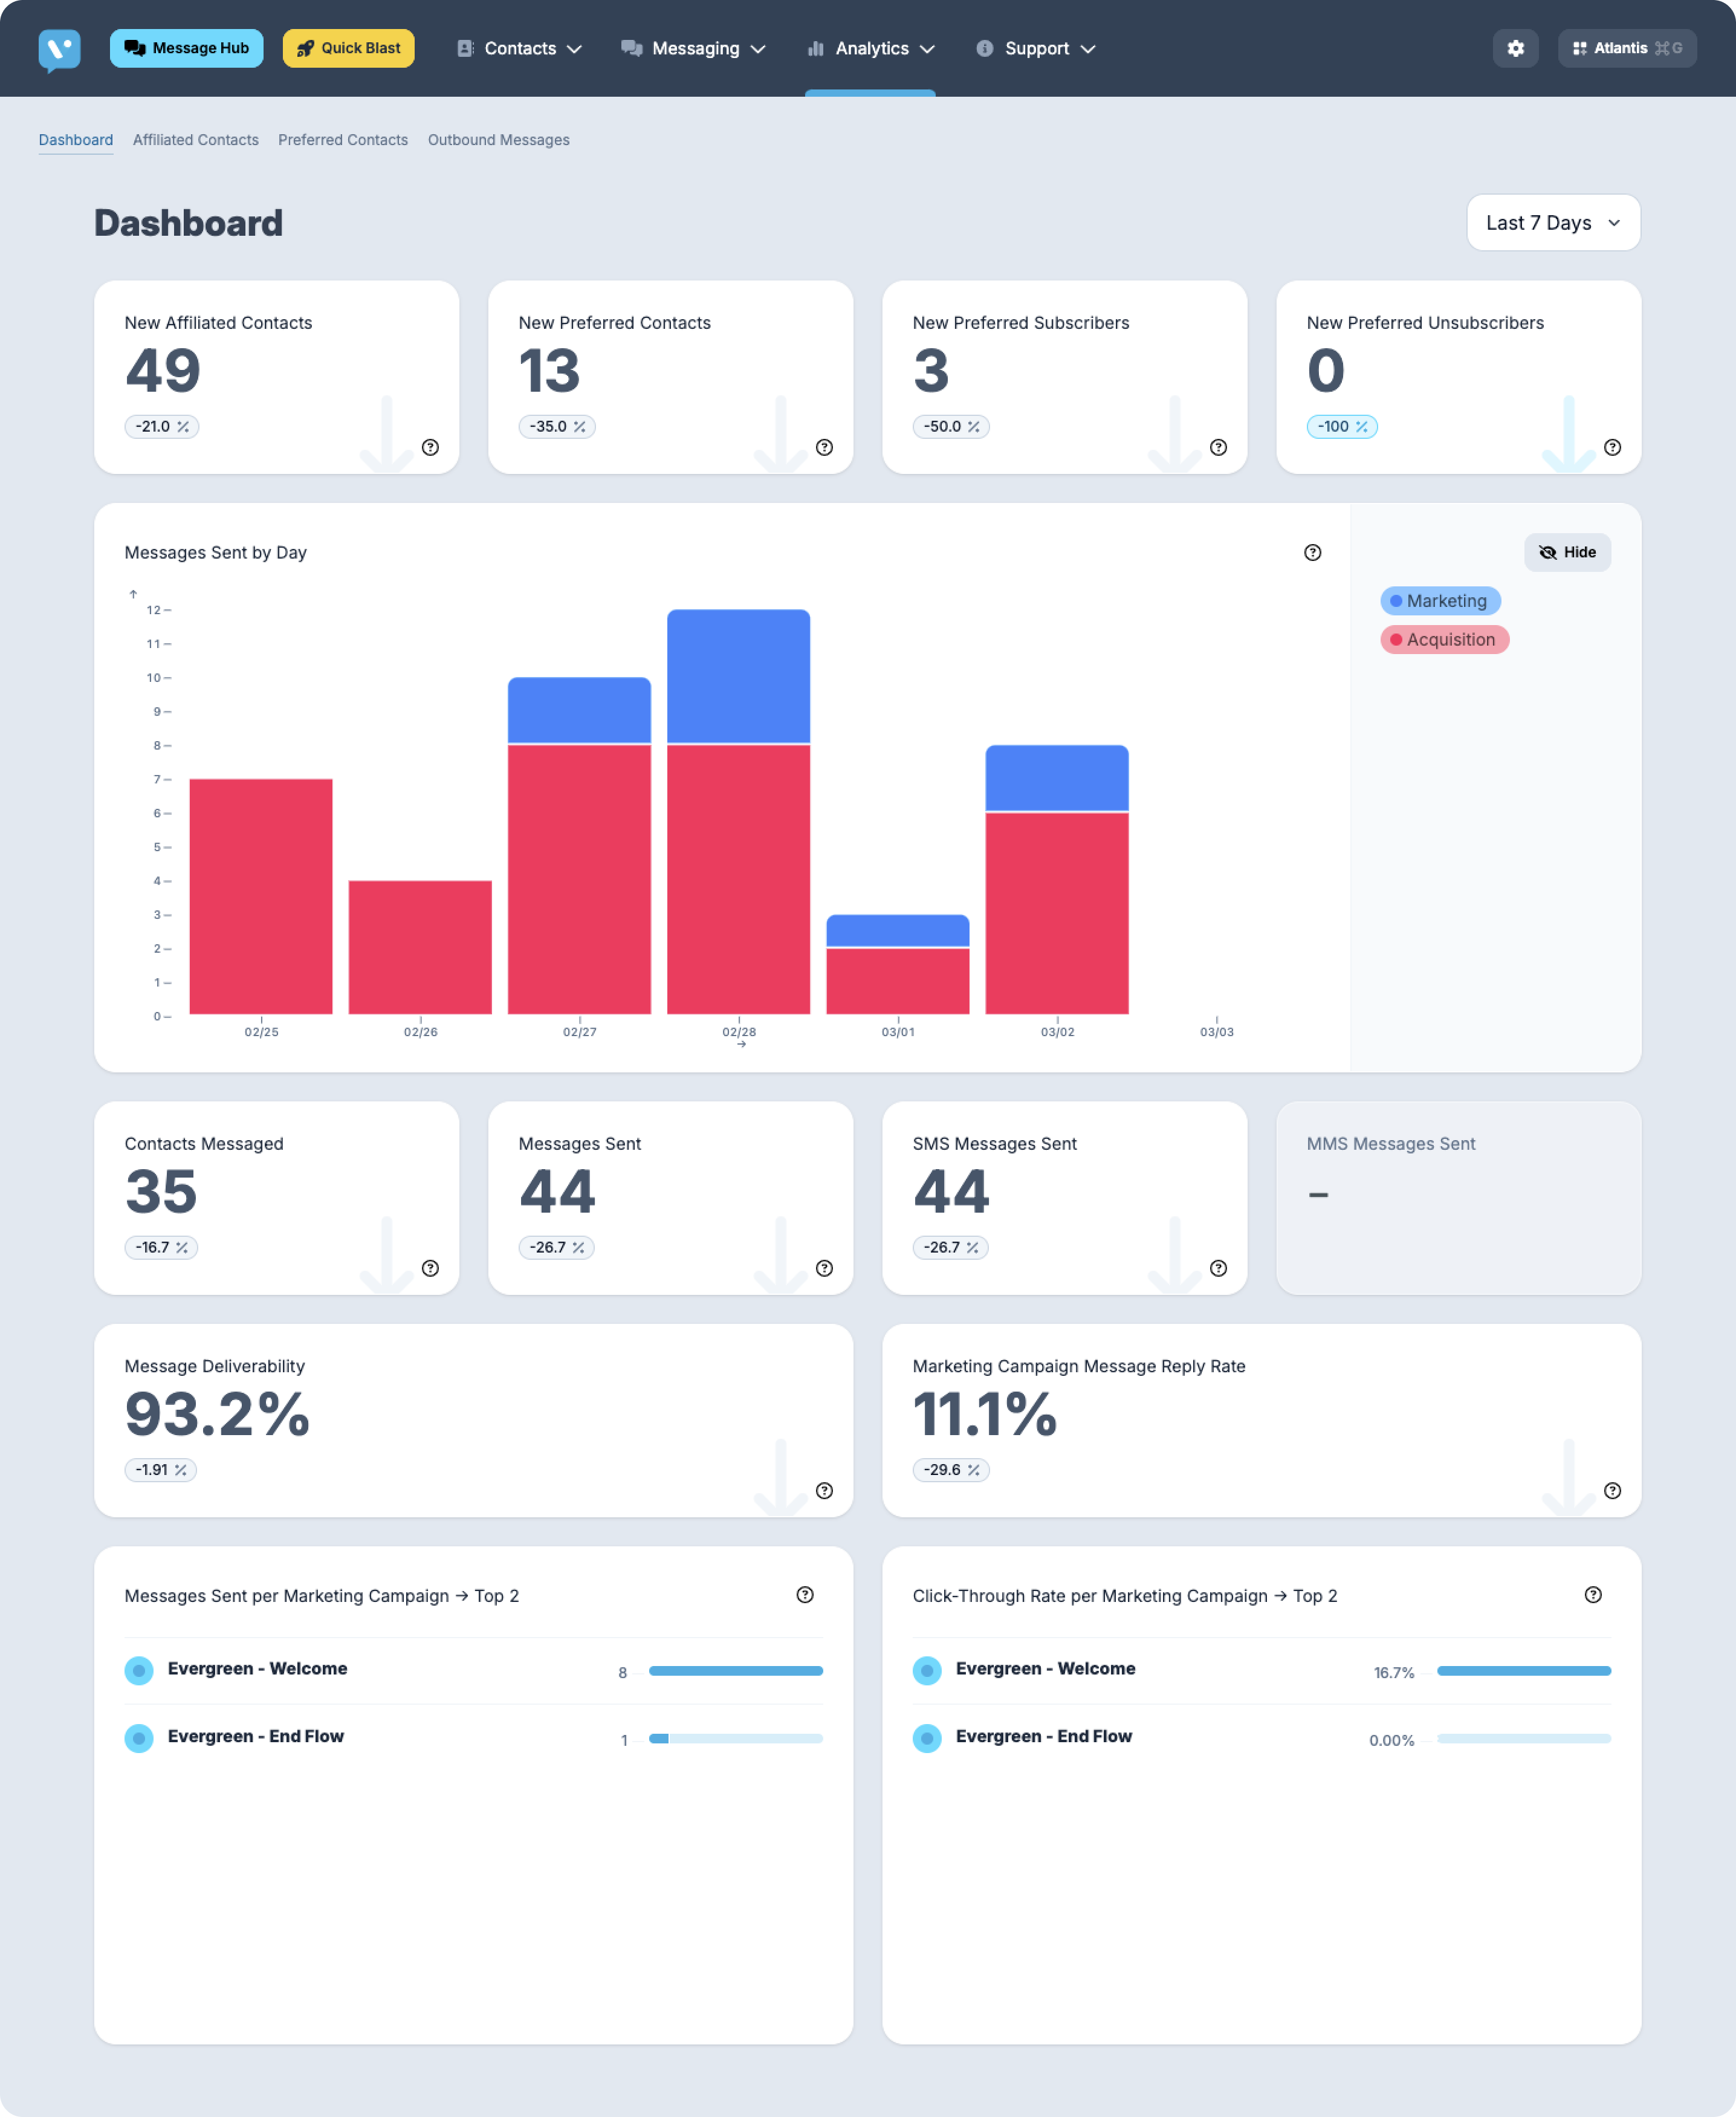
Dashboard - Metrics
The metrics shown in the dashboard are divided by sections:
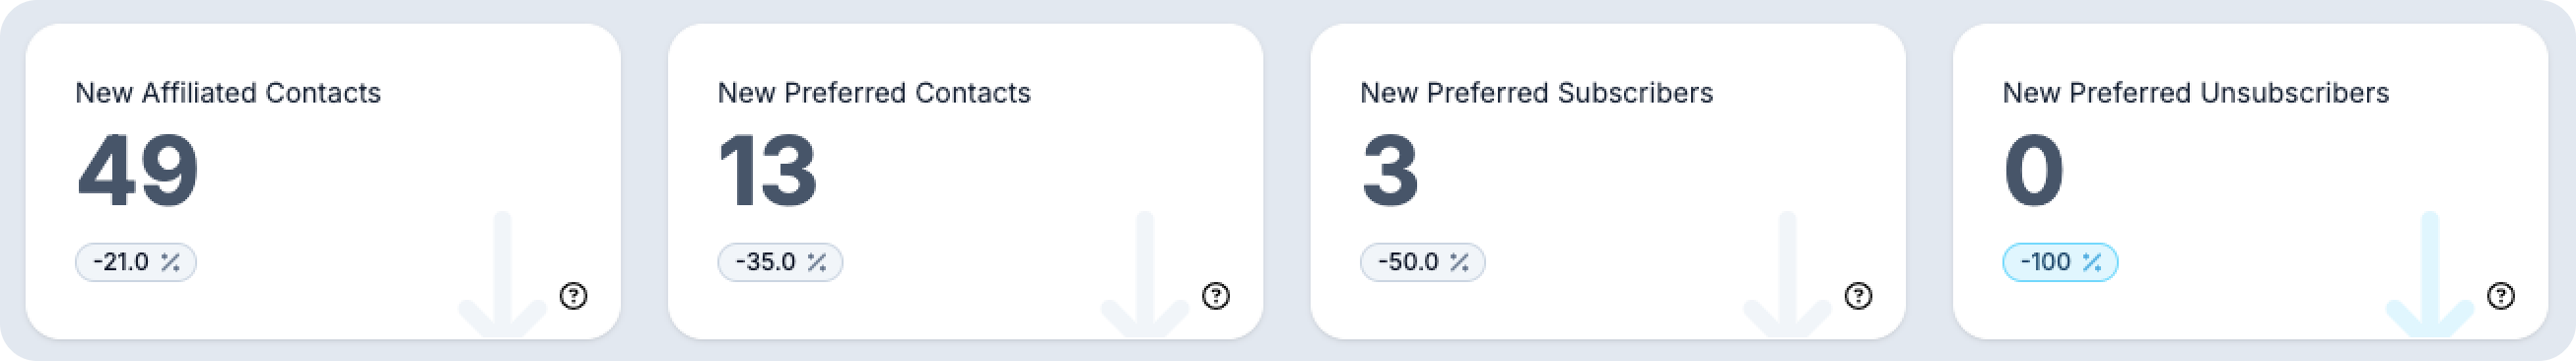
New Affiliated Shown
New affiliated Contacts: Gross Increase Count of Contacts that are at least affiliated with your location or department during the selected period.
New Affiliated Contacts %: Gross increase of Contacts that are at least affiliated with your location or department during the selected period relative to the previous period.
New Preferred Contact
New Preferred Contacts : Gross Increase Count of Contacts that have a unique relation with your location or department during the selected period.
New Preferred Contacts % : Gross increase of Contacts that have a unique relation with your location or department during the selected period relative to the previous period.
New Preferred Subscribers
New Preferred Subscribers : Gross Increase Count of Preferred Contacts that consented to receive marketing messages, during the selected period.
New Preferred Subscribers : Gross Increase Percent of Preferred Contacts that consented to receive marketing messages, during the selected period relative to the previous period.
New Preferred Contact
New Preferred Unsubscribers : Gross Increase Count of Preferred Contacts that have explicitly denied receiving marketing messages, during the selected period.
New Preferred Unsubscribers : Gross Increase Percent of Preferred Contacts that have explicitly denied receiving marketing messages, during the selected period relative to the previous period.
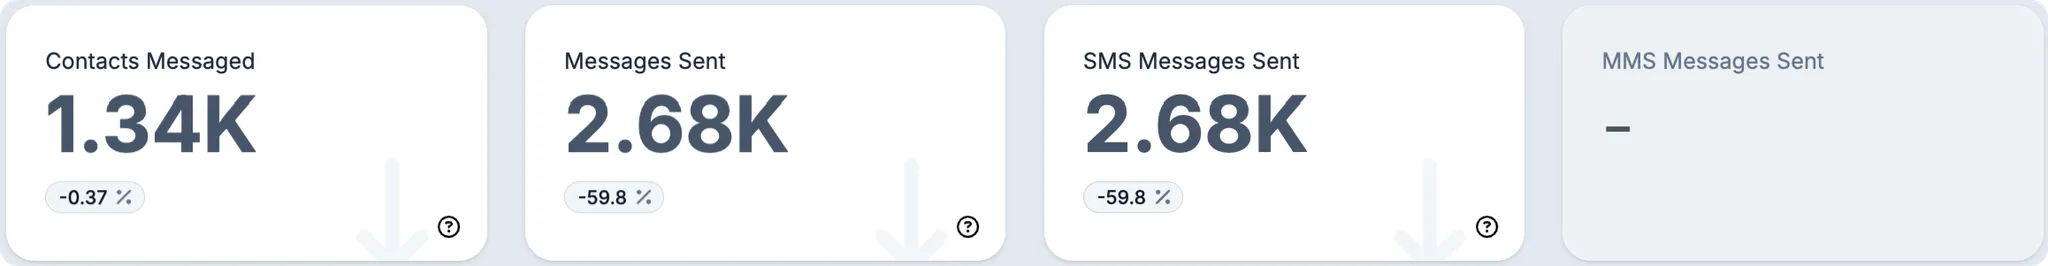
Messaged Contacts
Contacts Messaged: Gross Count of unique Contacts that have been messaged during the selected period
Contacts Messaged %: Gross Percent of unique Contacts that have been messaged relative to the previous period
Messages Sent
Messages Sent: Gross Count of Messages sent by Voxie during the selected period in the context of Marketing Campaigns
Messages Sent %: Gross Percent of unique Contacts that have been messaged relative to the previous period
SMS Messages Sent
SMS Messages Sent: Gross Count of SMS Messages sent during the selected period
SMS Messages Sent %:Gross Percent of SMS Messages sent relative to the previous period
MMS Messages Sent
MMS Messages Sent: Gross Count of MMS Messages sent during the selected period
MMS Messages Sent %:Gross Percent of MMS Messages sent relative to the previous period
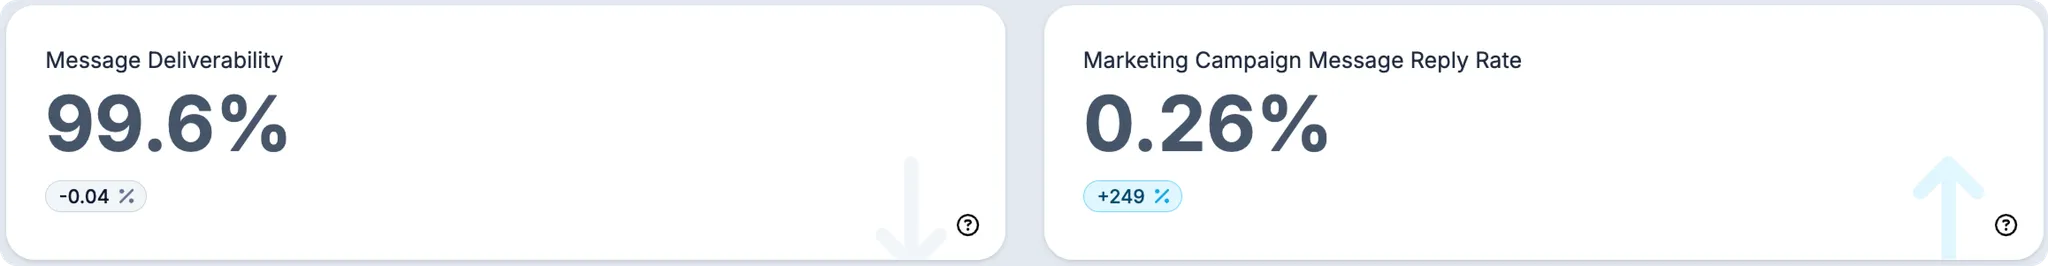
Message Deliverability
Message Deliverability: In the Context of Marketing Campaigns, percentage of the messages successfully delivered relative to the messages attempted during the selected period
Message Deliverability %: Variation of Message Deliverability relative to the previous period
Marketing Campaign Message Reply Rate
Message Reply Rate: In the Context of Marketing Campaigns, reply percentage of the messages delivered relative to the messages delivered during the selected period
Message Reply Var %: Variation of Message Reply Rate relative to the previous period
Dashboard - Charts
The charts shown in the dashboard show the distribution of relevant KPIs to enable quick action if needed:
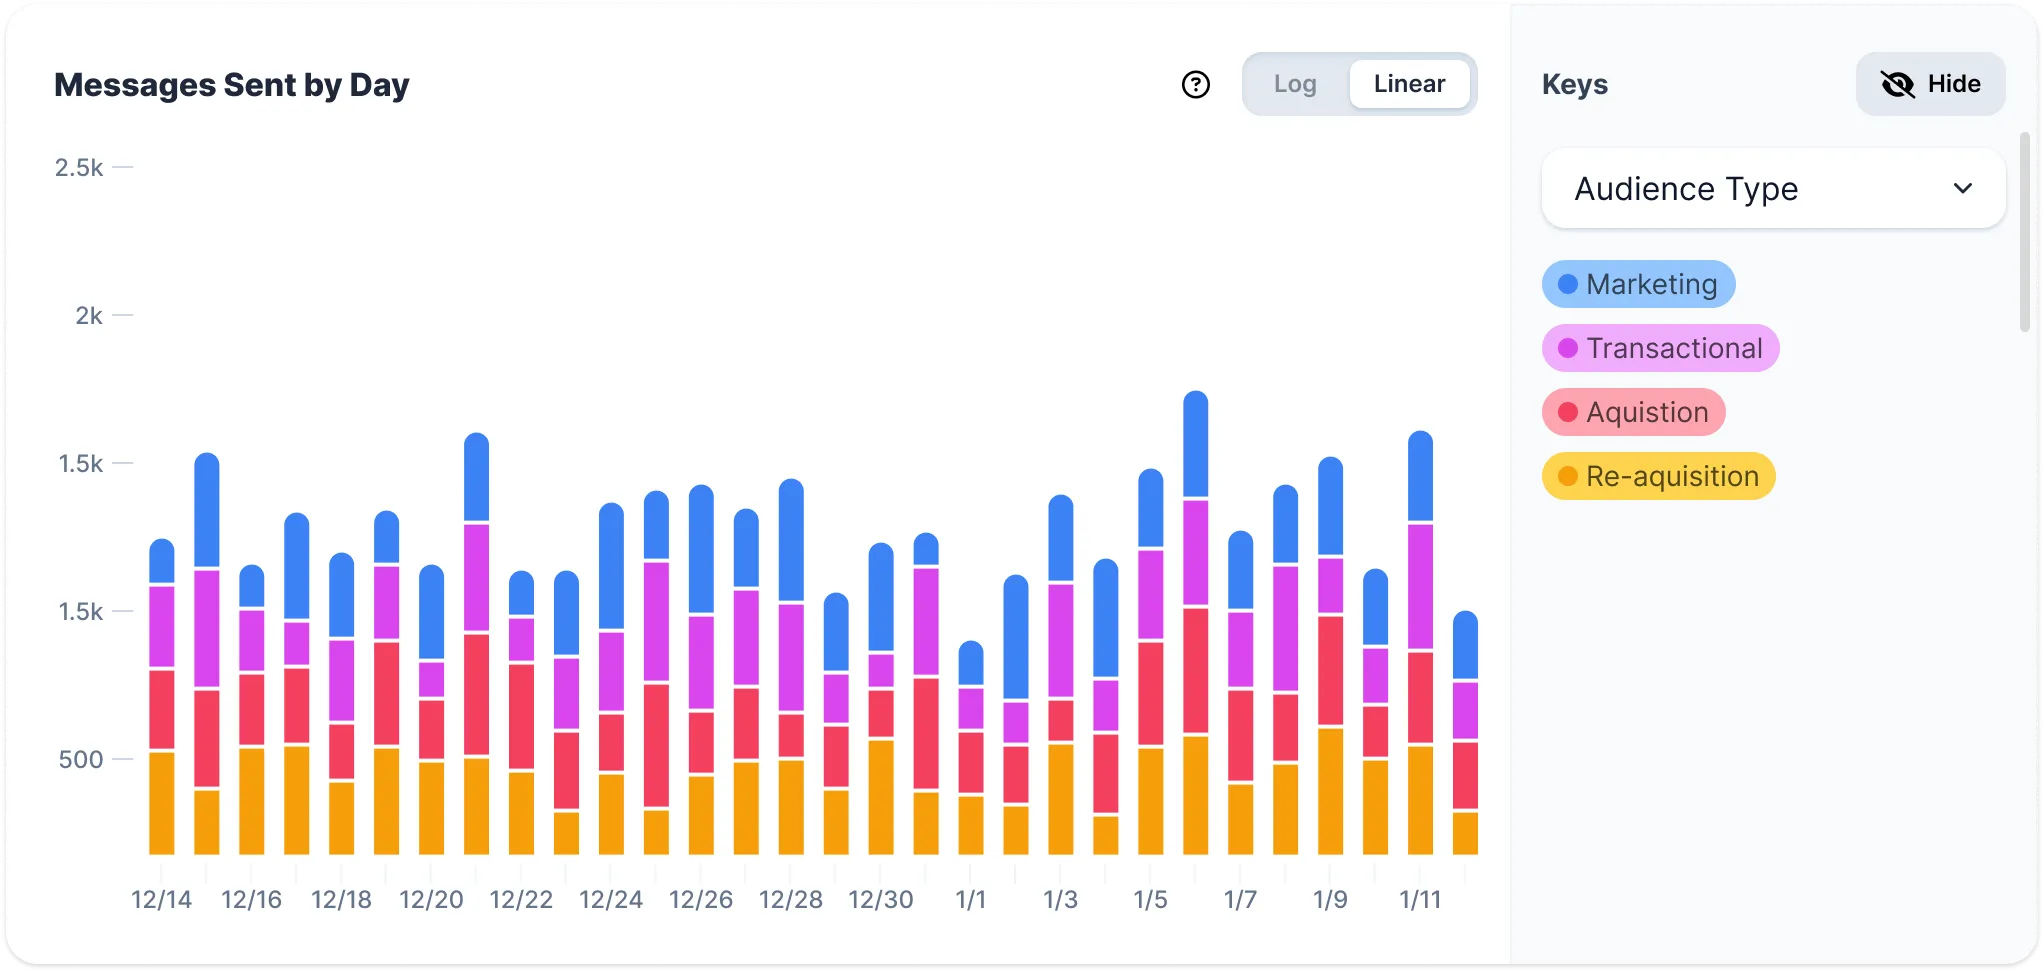
Messages Sent by Day
This chart allows you to evaluate the distribution of Messages Volume sent by Day (within evaluation period) and Audience Type
Marketing: Message is for promotional content such as discounts, coupons, offers, etc.
Transactional: Message is for support or in response to an explicit request from customer.
Acquisition: This is the first time you are messaging these contacts.
Re-acquisition: Contacts have opted-out of Marketing Messages. Contacts should have done something to prompt reaching back out to them.

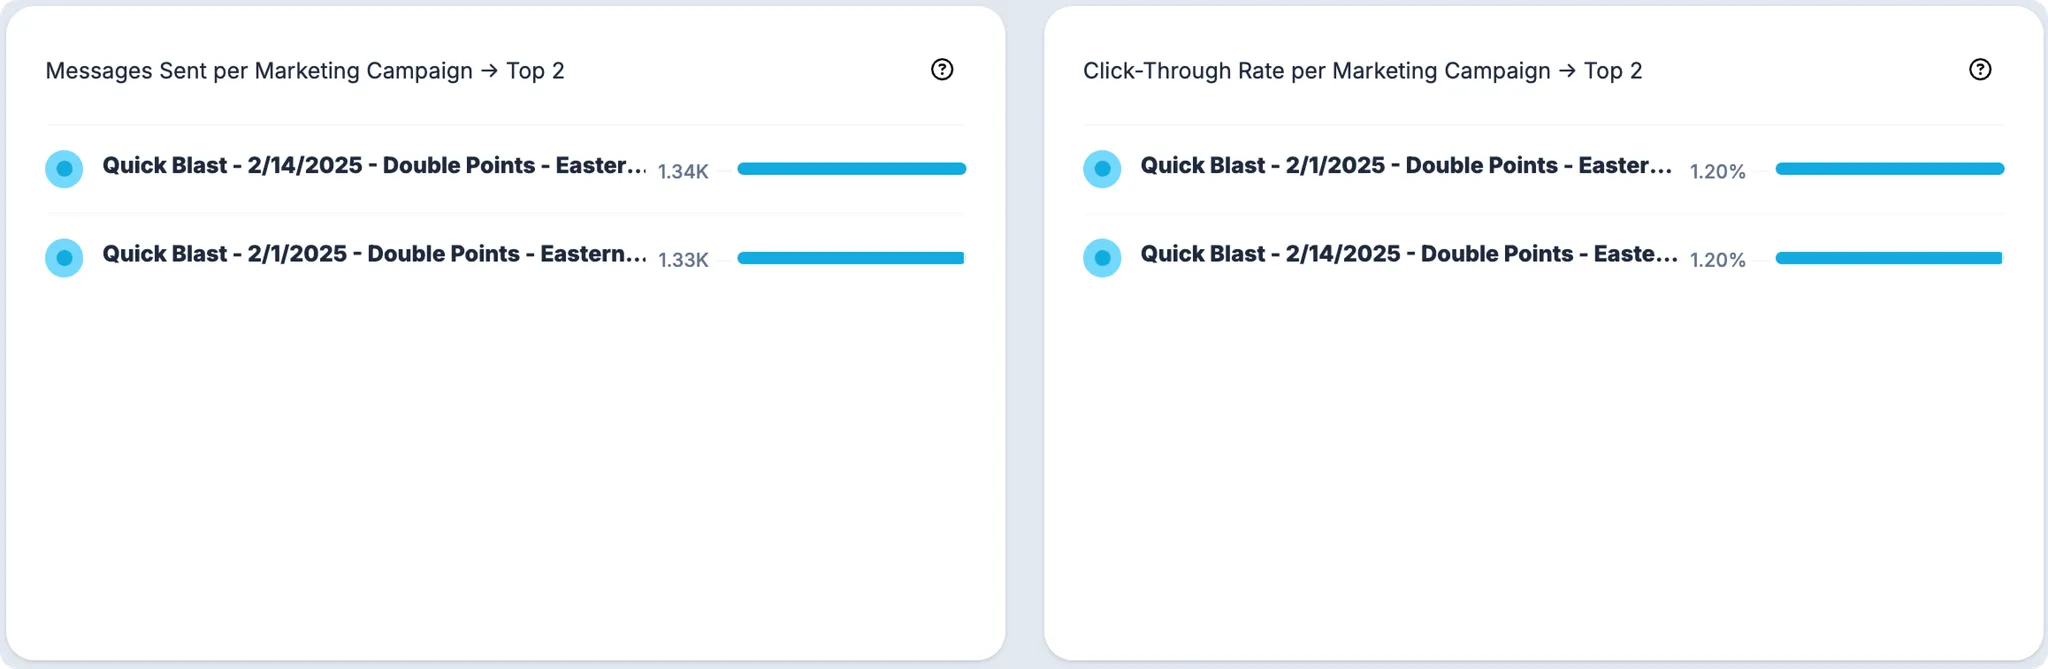
Messages Sent per Marketing Campaign
Messages Sent: Gross Count of Messages sent by each Marketing Campaign during the selected period.
Click-Through Rate per Marketing Campaign
Click-Through Rate: In the Context of Marketing Campaigns, in particular the ones that provide a clickable link; this metric allows you to evaluate the success through the relative clicks a campaigns receives relative to the quantity of messages delivered.
Affiliated and Preferred Contacts
Franchise Hub or Groups implementation introduces Contact ownership distinctions, which are:
- Affiliated Contacts: customer or lead who has a relationship with multiple franchise locations within the brand. This indicates a broader interest or engagement across the franchise network.
- Preferred Contacts: customer or lead who has a direct, exclusive relationship with a single, specific franchise location. This indicates a strong, primary connection.
As a result Franchisee Analytics provides 2 Contact Pages showcasing the performance of your Affiliated and Preferred contacts, allowing you to evaluate the behavior of your subscribers. You can change this default evaluation period of Last 30 Days from the following options:
Last 7 Calendar DaysMonday to TodayCurrent MonthLast MonthLast 30 DaysLast 90 Days(will show up only when 90 days data has been collected)

Contacts - Metrics
The metrics shown in the dashboard are divided by the following sections:

Contacts
New Contacts: Gross Increase Count of Contacts during the selected period
New Contacts %: Gross increase of Contacts during the selected period relative to the previous period
Total Contacts: Current Contacts Count existing in your Voxie instance
Subscribers
New Subscribers: Gross Increase Count of Contacts that consented to receive marketing messages, during the selected period
New Contacts %: Gross increase of Contacts that consented to receive marketing messages, during the selected period relative to the previous period
Total Subscribers: Current Contacts Count subject to be targeted by Marketing Campaigns, existing in your Voxie instance
Unsubscribers
New Usubscribers: Gross Increase Count of Contacts that have explicitly denied receiving marketing messages, during the selected period
New Usubscribers %: Gross increase of Contacts that have explicitly denied receiving marketing messages, during the selected period relative to the previous period
Potential Subscribers
Potential Subscribers: Quantity of Contacts that neither Opted in or out for Marketing Communications.
Contacts - Charts
The charts shown in the Contact Charts intend to show you distribution of relevant KPIs to enable quick action if needed:
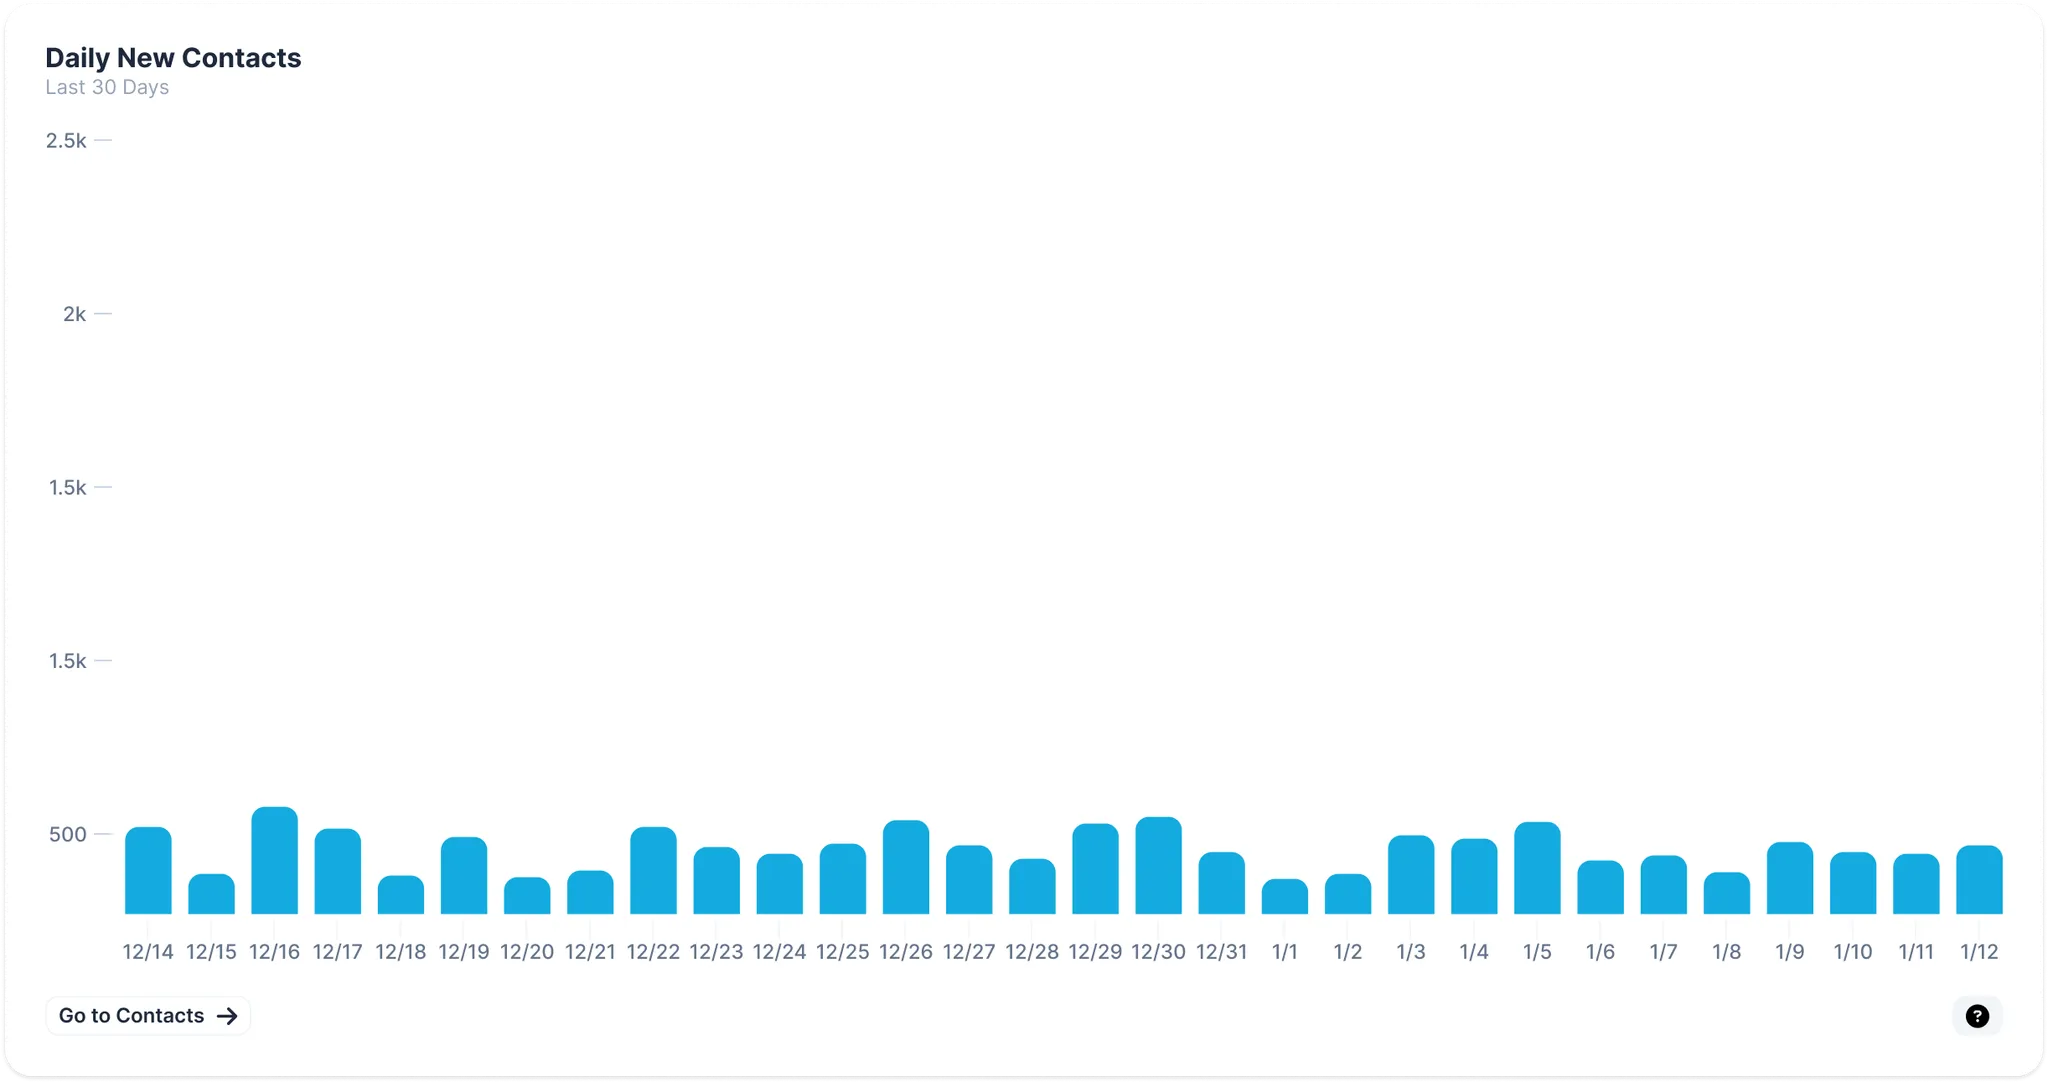
Daily New Contacts
Daily Gross Count of Contacts added into Voxie platform
New Contacts: Gross Increase Count of Contacts during the selected period
Outbound Messages
The Analytics Outbound Messages section, allows you to evaluate the performance of the Messages sent scoped under your particular Location, throughout all possible Voxie resources, including the ones managed by Corporate, like Automations, Playbooks and Evergreen Campaigns .

Side Navigation Bar - Filters

Range
Select your evaluation Period, there are no limitations in how far back you can set up your custom periods
Last 7 DaysLast 14 DaysLast 30 DaysCurrent MonthCustom Period
Resource Type
Default selection is set on ALL resources, so messages will be aggregated unless you select a single Resource Type. The possible Resource are:
Message Hub: Counts for the amount of messages sent using this source
Campaigns: Counts for the amount of messages sent using Campaigns in all its variants, including Evergreen, Duration and Quick Blast
Automations: Counts all the Messages sent using Automations “Send a Message” Actions
Playbooks: Counts for all Messages sent using Playbooks
Other: whatever message is sent that scapes the previously mentioned sources, will be accounted here, they could be API’s driven messages
Audience Type
Default Selection will be ALL, and therefore messages will be aggregated, you can select or deselect audience types and the charts will be updated with according figures
Resource Types - Metrics
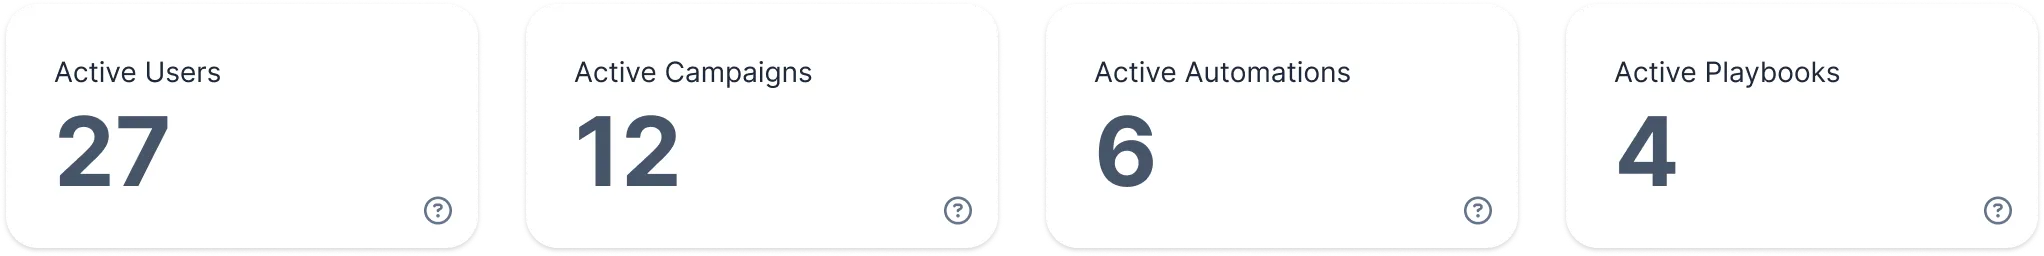
Active Users
Number of Message Hub Agents responsible for sending Messages in the selected period of time
Active Campaigns
Number of Marketing Campaigns that have been Live Campaigns in the selected period of time
Active Automations
Number of Automations Active that have at least an Action that sends a Message in the selected period of time
Active Playbooks
Number of Playbooks Active that are Running and responsible for Messages Sent in the selected period of time
Messages Sent by Day
Number of Messages (SMS & MMS) sent in the selected period of time distributed by Audience Type
Performance Metrics
The metrics shown in the Marketing Campaigns are divided by the next sections:
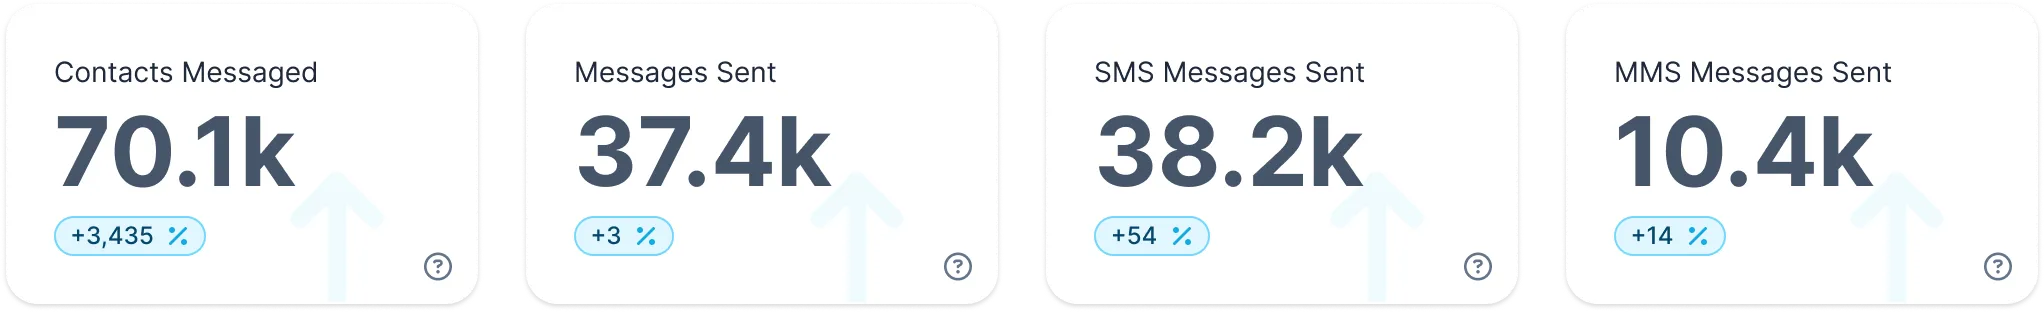
Contacts Messaged
Contacts Messaged: Gross Count of unique Contacts that have been messaged during the selected period.
Contacts Messaged %: Gross Percent of unique Contacts that have been messaged relative to the previous period.
Messages Sent
Messages Sent: Gross Count of Messages sent by Voxie during the selected period.
Messages Sent %: Gross Percent of Messages sent by Voxie relative to the previous period.
SMS Messages Sent
SMS Messages Sent: Gross Count of SMS Messages sent by Voxie during the selected period.
SMS Messages Sent %: Gross Percent of SMS Messages sent by Voxie relative to the previous period.
MMS Messages Sent
MMS Messages Sent: Gross Count of MMS Messages sent by Voxie during the selected period.
MMS Messages Sent %: Gross Percent of MMS Messages sent by Voxie relative to the previous period.
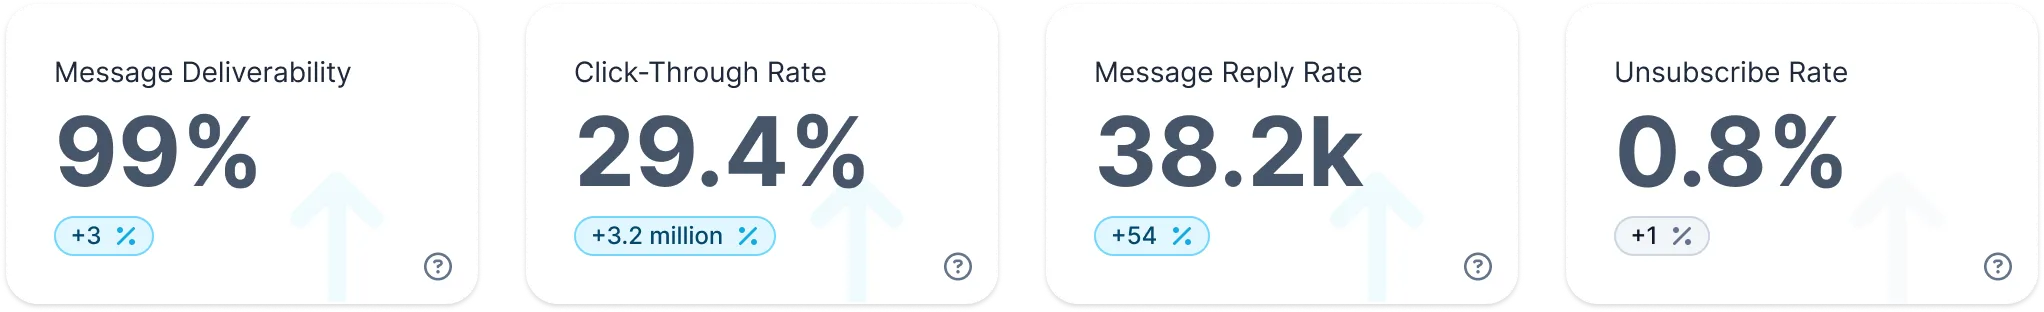
Message Deliverability
Messages Deliverability: In the Context of Messages sent, percentage of the messages successfully delivered relative to the messages attempted during the selected period.
Message Deliverability %: Variation of Message Deliverability relative to the previous period.
Click-Through Rate
Messages Click-Through Rate: In the Context of Messages sent, in particular the ones that provide a clickable link, this metric allows you to evaluate success through the relative clicks an Initiative receives relative to the quantity of messages delivered (counts for all clicks, not uniques)
Message Click-Through Rate %: Variation of Click-Through Rate relative to the previous period.
Message Reply Rate
Rate: Reply percentage of the messages delivered relative to the messages delivered during the selected period.
Rate Variation: Variation of Message Reply Rate relative to the previous period.
Unsubscribe Rate
Rate: Overall percentage of Contacts that have explicitly denied receiving marketing messages as the result of Sender resources.
Rate Variation: Variation of Unsubscribe rate during the selected period relative to the previous period.
Resources - Charts
The charts shown in the Contact Charts show the distribution of relevant KPIs to enable quick action if needed:

Message Sent Per Resource → Top 10
Messages Sent: Most relevant Voxie Resources in terms of Gross Count of Messages sent during the selected period.
Click-Through Rate per Resource → Top 10:
Click-Through Rate: Most relevant Voxie Resources, in particular the ones that provide a clickable link; this metric allows you to evaluate the success through the relative clicks a Message Resource receives relative to the quantity of messages delivered
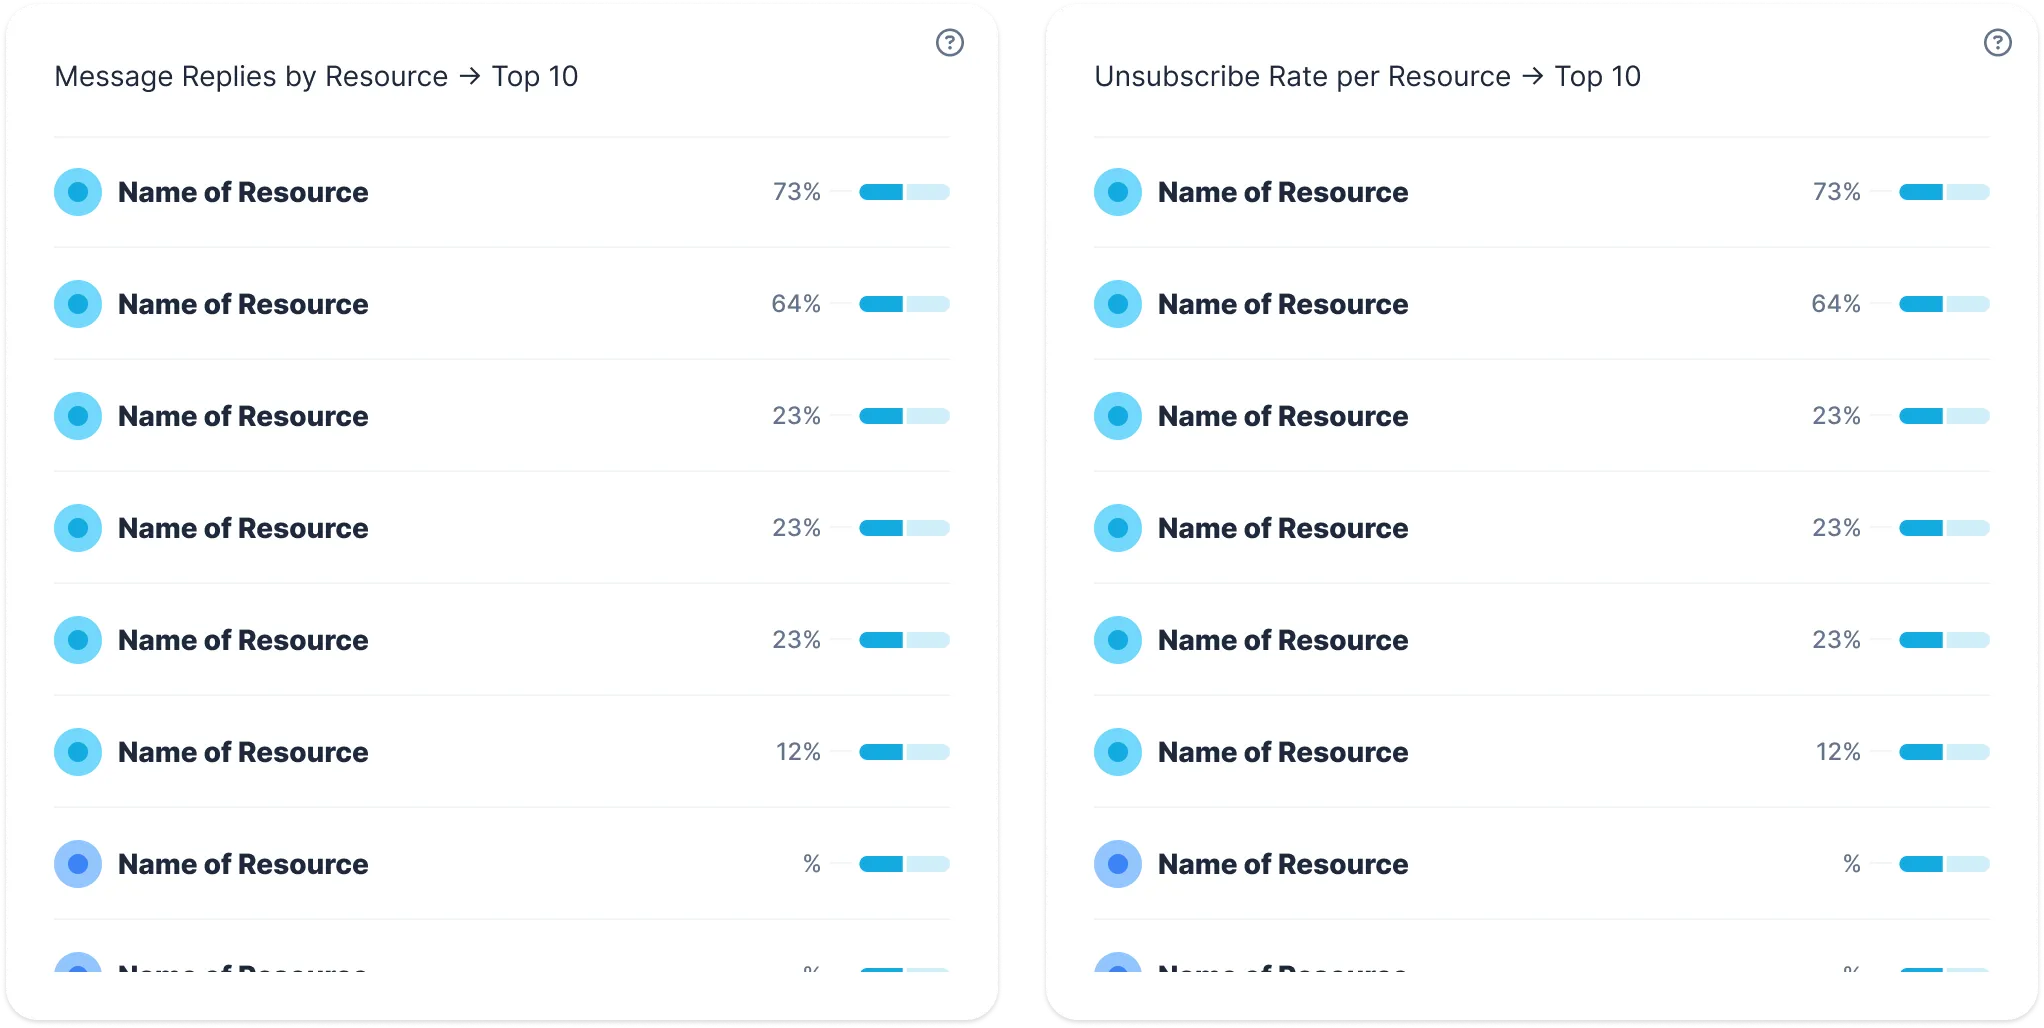
Message Replies by Resource → Tip 10
Message Reply Rate: Most relevant Voxie Resources in terms of reply percentage of the messages delivered relative to the messages delivered during the selected period.
Unsubscribe Rate per Resource -> Top 10
Usubscribers %: Most relevant Voxie Resources in terms of opt-out percentage relative to the messages delivered during the selected period.
Resource - Single Resource Details
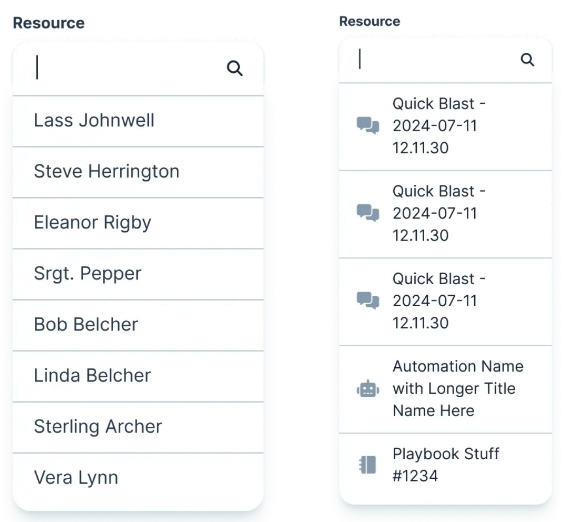
User can select a particular Resource to evaluate its details to depth, the KPIs are recalculated in the context of the selected resource